Key Questions:
How has the population of the world been changing?
Describe detailed examples of two or more contrasting countries with respect to population change and demographic transition over time [including natural increase, fertility rate, life expectancy, population structure and dependency ratios]
Outline one case study of a contemporary megacity experiencing rapid growth.
Discuss the causes and consequences of forced migration and internal displacement. [Give detailed examples of two or more forced movements, to include environmental and political push factors, and consequences for people and places.
Key Understanding:
The impacts of population change and spatial interactions between places can be categorized and represented graphically.
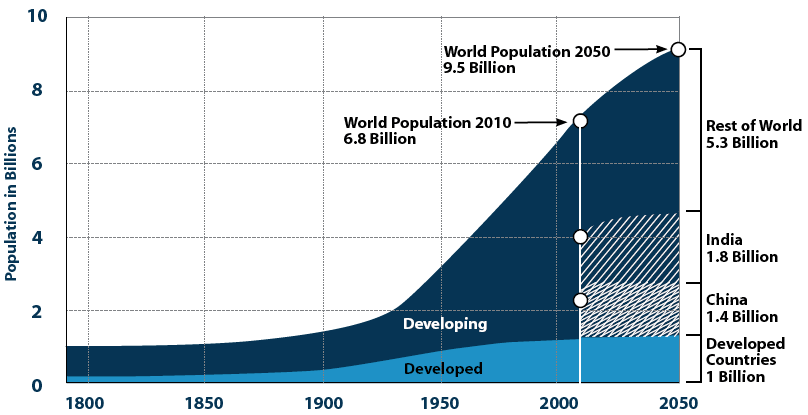
Why has the population been changing?
Populations change because of:
A – Migration
B – Natural increase/decrease
For the world change is due to natural increase/decrease only.
Birth rate
The number of live births per 1000 people living in a place per year. Sometimes expressed as a %.
Death rate
The number of deaths per 1000 people living in a place per year
Natural increase/decrease
The net change in the total population of an area due to the difference between the number of births and deaths.
Measured using: Birth Rate – Death Rate and usually expressed per 1000 people.
Factors influencing Birth & Death Rates
How do changes in birth and death rates over time cause populations to change?
The Demographic Transition Model (DTM)![]()
Can the DTM be applied spatially?
Birth rates for countries (CIA)
Death rates for countries (CIA)
What is happening to fertility rates and life expectancy around the world?
The Fertility rate refers to the number of children a woman is expected to have during her lifetime, based on current birth rates.
Fertility rates in South Korea are now <1. This has serious implications for the country.
Life expectancy is the number of years that the average person, born in a given place may expect to live.
Video – Hans Rosling: The best stats you’ve ever seen
What is population structure?
Population structure refers to how the population in a given place is made up in terms of the gender and ages of the people who live there. It is usually shown in the form of a chart called an age-sex pyramid or population pyramid.
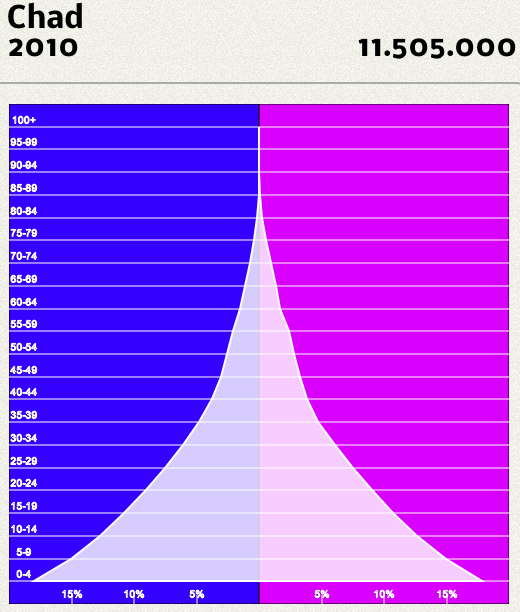
populationpyramid.net displays population structures.
Dependency ratios
Consequences of megacity growth
Causes & consequences of forced migrations and internal displacement
Forced migration & internal displacement – Intro PowerPoint
Syrian migration data from the Pew Research Center – Jan 2018
Internal Displacement Monitoring Centre website
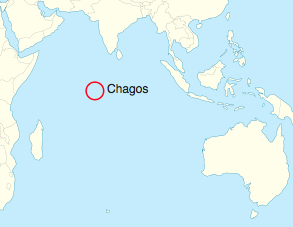
Example – The case of Diego Garcia, Chagos Archipelago.